-
A
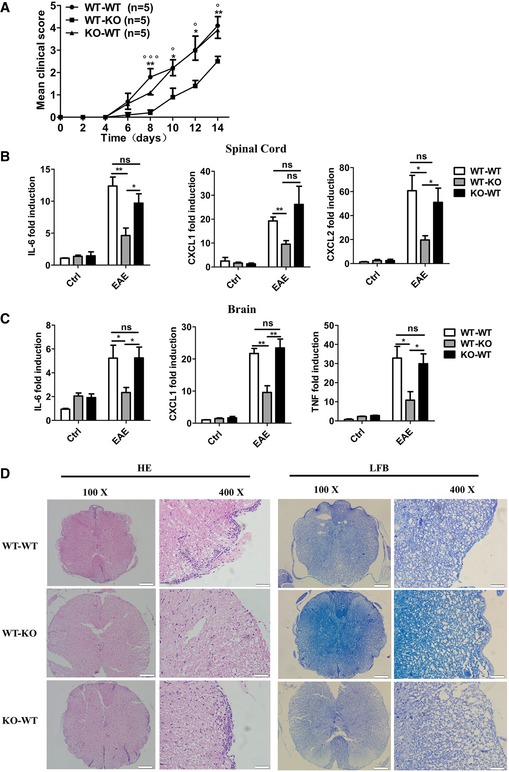
Mice with reconstituted bone marrow were immunized with MOG (35‐55) to induce EAE. Mean clinical scores were calculated every other day according to the standards described in the Materials and Methods section (*WT‐WT versus WT‐KO; °KO‐WT versus WT‐KO).
-
B, C
IL‐6, TNF‐α, CXCL1, and CXCL2 mRNA in the spinal cords (B) or in the brains (C) were measured by real‐time PCR on day 14 after the second MOG immunization.
-
D
Histology of the spinal cord was analyzed by hematoxylin and eosin (HE) or Luxol fast blue (LFB) staining on day 14 after the second MOG immunization. Scale bars for the left panel, 200 μm; scale bars for the right panel, 50 μm.
Data information: ns, not significant, *
P < 0.05 and **
P < 0.01; °
P < 0.05 and °°°
P < 0.001 (unpaired, two‐tailed Student's
t‐test). Similar results were obtained in two independent experiments. Error bars are mean ± SEM values.

