-
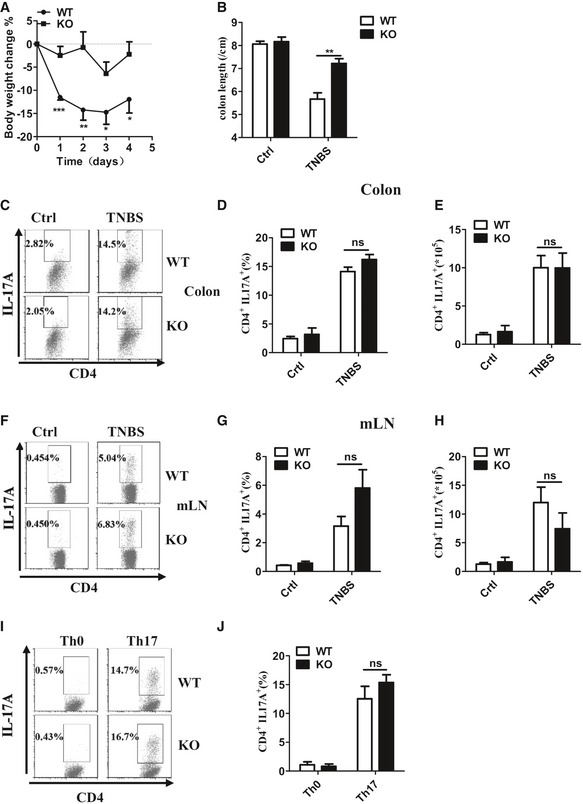
A, B
WT (n = 6) and Ndr1‐KO (n = 5) mice were presensitized with 1% TNBS and then were rectally injected with TNBS at a dose of 150 mg/kg body weight on day 7. Changes in body weight (A) and colon length (B) were measured in WT and Ndr1‐KO mice with TNBS for a total of 4 days. Mice were euthanized on day 4.
-
C–E
Colons were collected on day 4; then, colonic propria cells were separated and stained with anti‐mouse markers CD4 and IL‐17A and then analyzed by flow cytometry. A representative plot of Th17 cell frequency (C) and a summary graph of Th17 cell frequency (D) and number (E) were showed.
-
F–H
The mesenteric lymph node cells were treated as in Fig
3C. A representative plot of Th17 cell frequency (F) and a summary graph of Th17 cell frequency (G) and number (H) were showed.
-
I, J
Naive CD4+ T cells (CD44loCD62Lhi) isolated from Ndr1‐KO mice and control littermates (WT) were stimulated for 7 days with anti‐CD3 and anti‐CD28 under Th0 or Th17 conditions as described in the Materials and Methods section. Flow cytometry was used to measure the frequency of IL‐17‐producing cells, which is shown a representative plot (I) and a summary graph (J).
Data information: ns, not significant, *
P < 0.05, **
P < 0.01 and ***
P < 0.001 (unpaired, two‐tailed Student's
t‐test). Similar results were obtained in three independent experiments. Error bars are mean ± SEM values.

