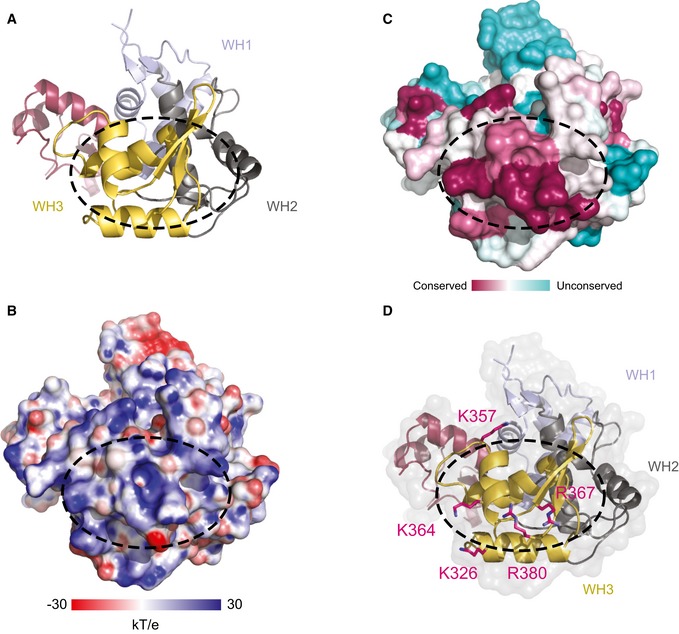
Figure 3. DNA‐binding domain of Dcc1.

- Ribbon diagram of the C‐terminal domain of Dcc1 with the triple WH domains: WH1 (blue), WH2 (grey) and WH3 (yellow).
- The surface charge of the C‐terminal domain of Dcc1 with positive areas in blue and negative in red.
- The surface conservation of Dcc1 with highly conserved regions in dark pink and the unconserved regions in pale blue.
- Potential DNA‐binding basic residues tested by mutational analysis depicted in stick representation.
