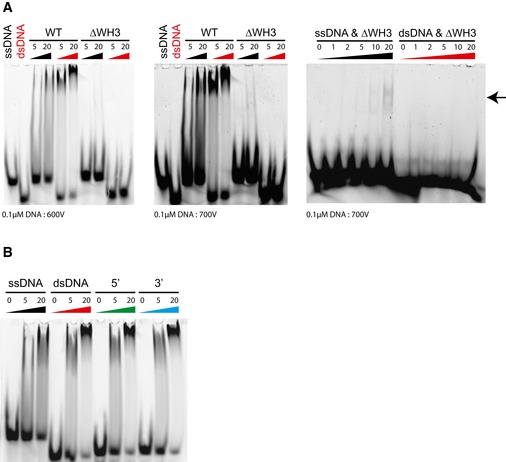
Figure EV3. Additional DNA binding and functional analyses.

- DNA EMSA showing residual binding to ssDNA (indicated by arrow) but not dsDNA by the WH3‐deleted Dcc1 construct. Protein concentrations are given in μM.
- DNA EMSA showing binding of Dcc190–380 to 18‐bp substrates containing 7‐bp 5′ or 3′ overhangs. Protein concentrations are given in μM.
