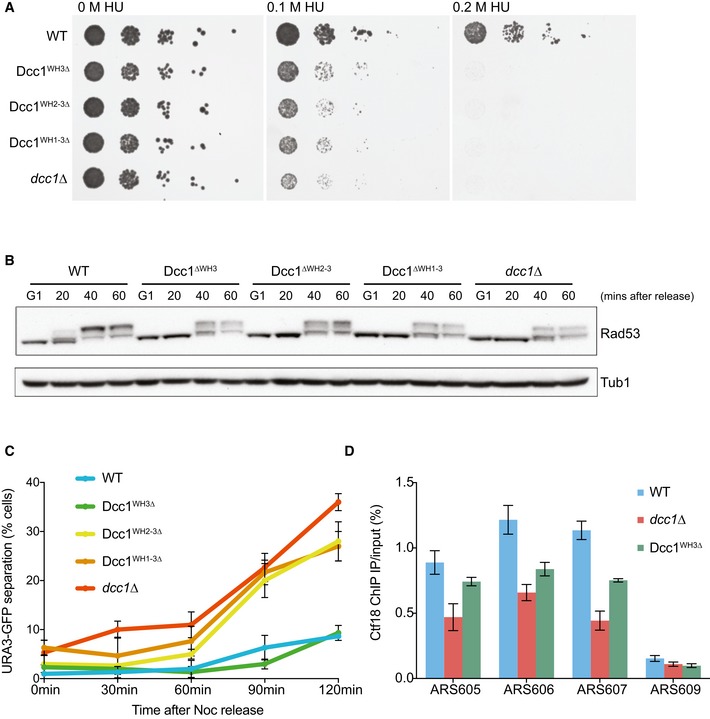
Figure 5. Functional analyses of WH domains.

- Spot assay showing the effect of deleting WH domains. The resistance of dcc1∆, Dcc1∆WH3, Dcc1∆WH2‐3 and Dcc1∆WH1‐3 strains compared to wild‐type cells in hydroxyurea (HU) was tested by spotting 10‐fold serial dilutions on YPD agar containing either 0 M, 0.1 M or 0.2 M HU.
- Checkpoint activation as assessed by Rad53 phosphorylation. Cells were arrested in G1 and released into medium containing 0.2 M HU for arrest in early S‐phase. Samples were taken at the indicated time points and analysed for Rad53 phosphorylation by Western blotting. Tubulin was used as a loading control.
- Sister chromatid cohesion assay using the same deletions as described above. The effect on sister chromatid cohesion was analysed by visualising tetracycline repressor‐GFP fusion proteins bound to tetracycline operator arrays integrated at the URA3 locus from cells arrested in a nocodazole‐imposed mitotic arrest. The percentage of cells with two TetR‐GFP dots were recorded. Three independent replicates were performed, and error bars indicate the standard deviation.
- Analysis of Ctf18 levels at origins in HU‐arrested cells. ChIP was conducted with an anti‐HA antibody against HA‐Ctf18. The enrichment was analysed by qPCR at three early firing origins (ARS605, ARS606 and ARS607) and a late‐firing origin (ARS609) on the indicated yeast strains. The means and standard error of three independent experiments are plotted. Analysis of Ctf18 levels averaged over all three early origins by three‐way ANOVA demonstrated statistically significant reductions in both the dcc1∆ (decrease = −0.555, P = 5.06897e‐11) and Dcc1WH3∆ (decrease = −0.3018, P = 1.1074164e‐06) strains.
