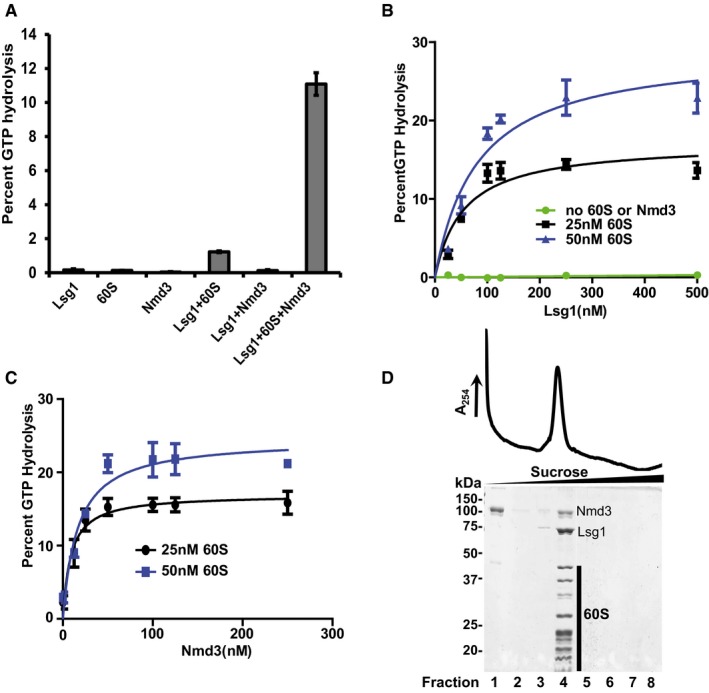
Figure 1. Lsg1 and Nmd3 form an active complex with the 60S subunit.

- Percent GTP hydrolysis in reactions containing 125 nM Lsg1, 100 nM Nmd3, or 25 nM 60S alone, or in the indicated combinations, was determined by monitoring the release of free phosphate as described in Materials and Methods.
- Representative curves for percent GTP hydrolysis by increasing concentrations of Lsg1, as indicated in the figure, without Nmd3 or 60S subunit (green) or reactions containing 100 nM Nmd3 with 25 nM (black) and 50 nM (blue) 60S.
- Representative curves for percent GTP hydrolysis by 125 nM Lsg1 in reactions containing 25 nM (black) and 50 nM (blue) 60S subunits, and increasing concentrations of Nmd3.
- Migration of 60S‐Nmd3‐Lsg1 complex (stoichiometry of 1:4:5) in the presence of GMPPNP after sedimentation through 10–30% sucrose. Fractions were precipitated with 10% TCA and analyzed on 10% SDS–PAGE. MBP‐(TEV)‐HIS6‐Nmd3 and Lsg1‐6His and 60S subunit proteins are indicated.
