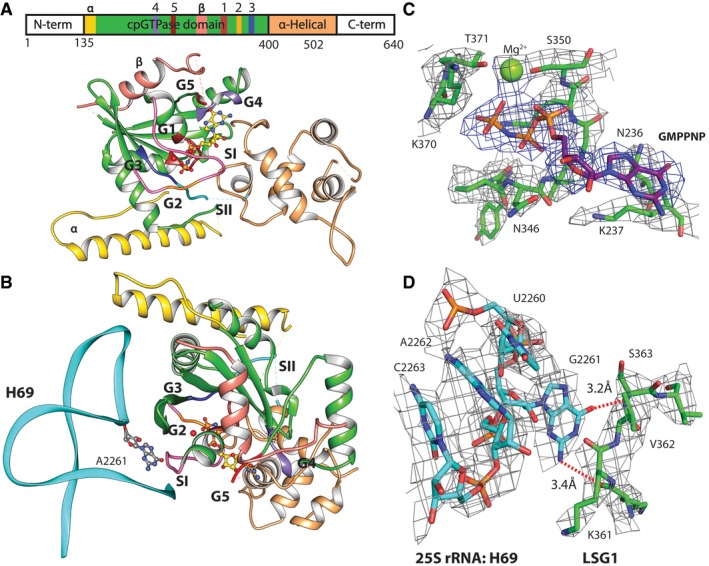
Figure 5. The structure of Lsg1.

- Domain view of Lsg1 in the presence of GMPPNP. Sequence motifs G1–G5 and Switch regions are shown in different colors. G1, red; G2, orange among the pink of Switch I; G3, blue; G4, purple; G5, brown; and Switch II in teal. Residues 135–175 are shown in yellow and marked with “α”. Extra insertion in the cpGTPase domain is shown in salmon and marked with “β”, and the α‐helical domain is shown in tan. Linear sequence map shows all of the domains and G motifs in the corresponding colors.
- Lsg1 as in (A), but rotated around the horizontal axis and with helix 69 showing flipped‐out G2261.
- Density of the GMPNP pocket shown at 4 sigma and Pymol carve level of 2.4 Å.
- Map density around G2261 and opposing residues of Switch I, distances to possible backbone contacts are shown with red dashed lines. Density shown at 4 sigma and Pymol carve level of 2 Å.
