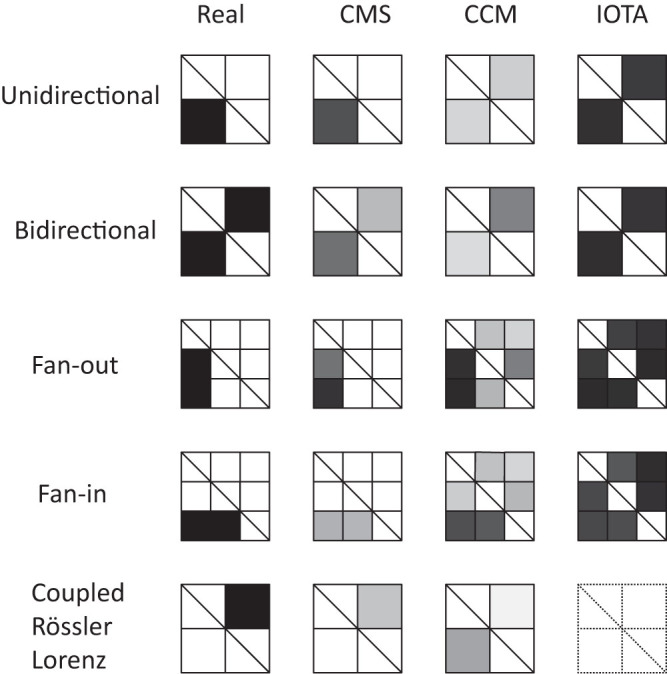
Figure 11. Comparison results for three methods on theoretical models.

The left column shows the causality patterns in 5 models, where black blocks shows causality from vertical variables to horizonal variables. The gray scale represents the strength of the detected causality between 0 (white) and 1 (black).
