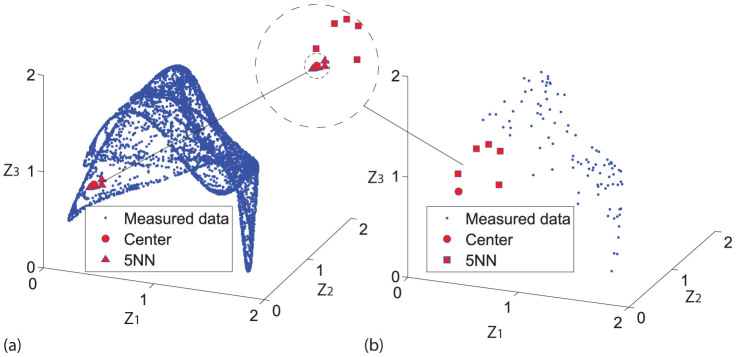
Figure 2. Illustration for the time series length and convergence of nearest neighbors.
Here the time series are generated by one chaotic Lotka-Volterra system. (a) A reconstructed attractor from time series of 7000 samples, and the 5 nearest neighbors (5NN) of one center point. (b) A reconstructed attractor from time series of only 100 sampled points and the 5 nearest neighbors of the same center point. Inset: the comparison of the 5 nearest neighbors for both (a) and (b), where the latter set of points are apparently not close to the center point at all.

