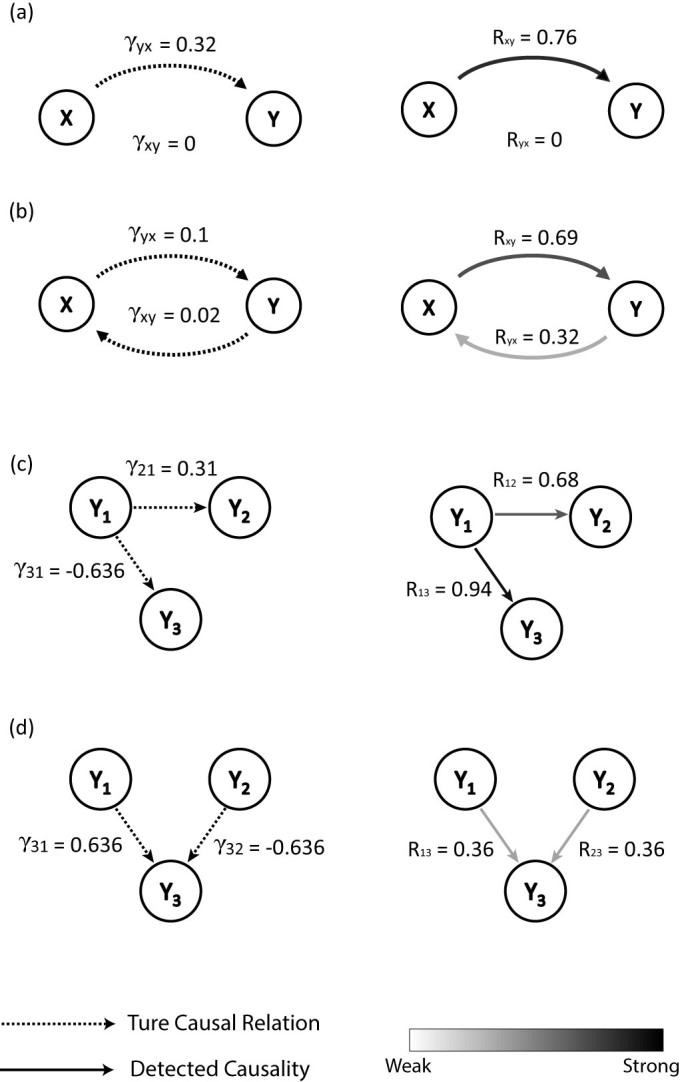
Figure 4. Coupling relationship patterns (coupling strength γ in the left column) and the corresponding causality patterns (detected index R in the right column), where only the significantly detected causal relations above threshold are shown.

(a) Unidirectional causality pattern in the 2 species model. (b) Bidirectional causality pattern in the 2 species model. (c) Fan-out causality pattern. (d) Fan-in causality pattern.
