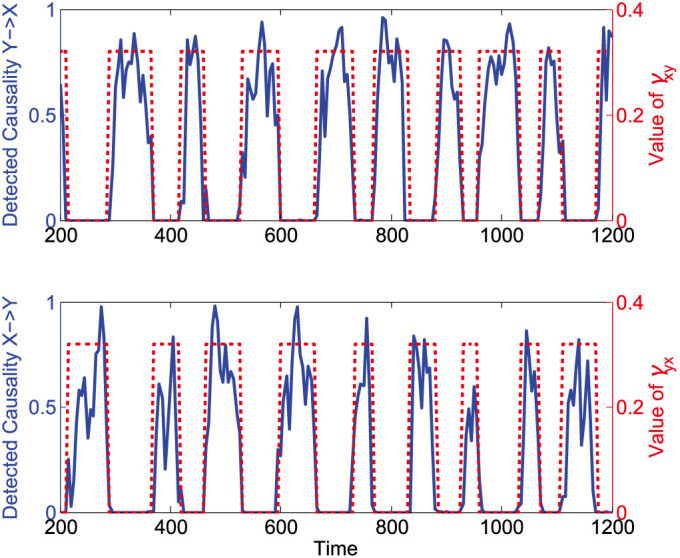
Figure 6. Causality detection for a parameter-varying system in a piecewise manner.

The dashed square waves represent the random switching of the coupling parameters between zero and nonzero values, and the solid lines represent the detected strengths of causative effectiveness over each time window.
