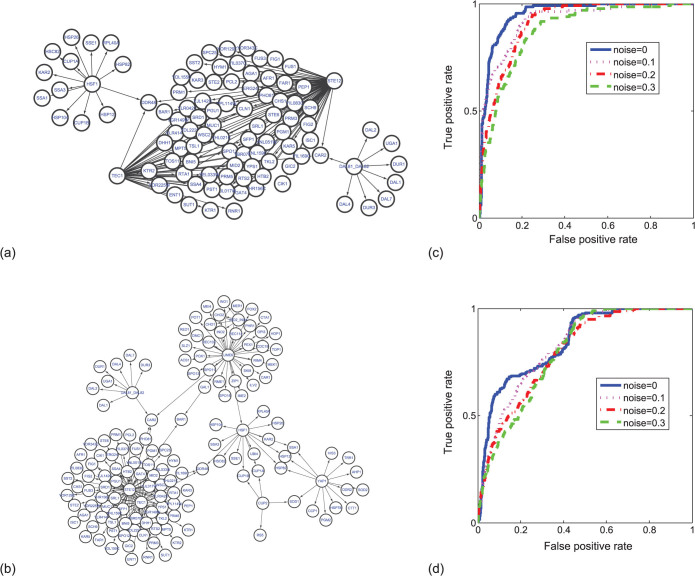
Figure 8.
(a) Regulatory network with the selected 100 genes of S.cerevisiae. (b) Regulatory network with the selected 150 genes of S.cerevisiae. (c) The ROC curves of the results for the network in (a) by our method, with different levels of the noise condition. (d) The ROC curves of the results for the network in (b) by our method, with different levels of the noise condition.

