Fig. 5.

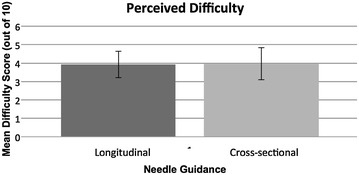
Graph showing the mean perceived difficulty rating for each of the two approaches. Error bars represent the 95% confidence limits of the means

Graph showing the mean perceived difficulty rating for each of the two approaches. Error bars represent the 95% confidence limits of the means