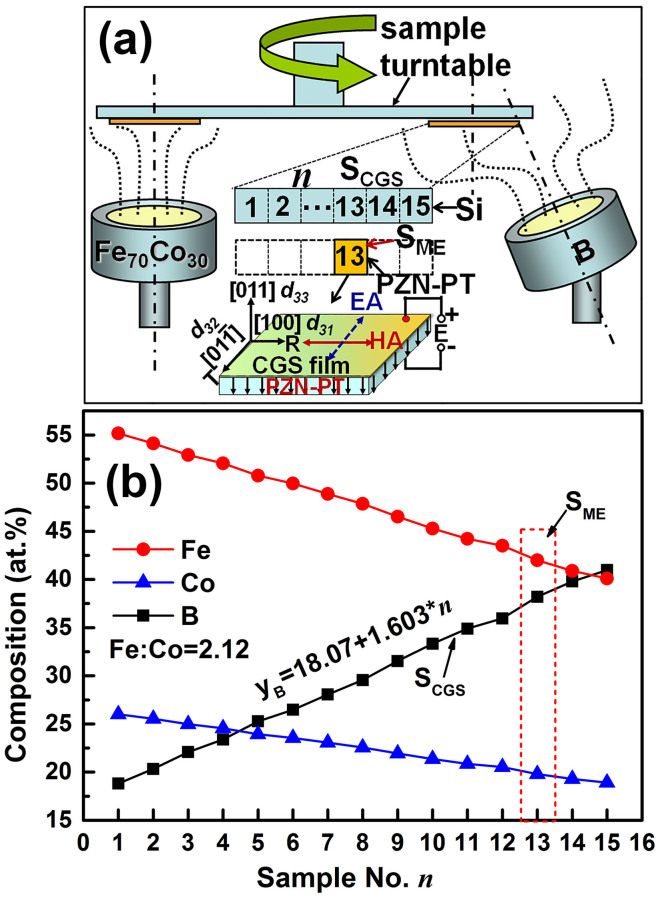
Figure 1. The CGS device and composition distribution.
(a) The schematic drawing of composition gradient sputtering (CGS) device, and (b) the composition distribution detected by a field emission electron probe microanalyzer. The insets of Figure 1a from top to bottom shows the position distribution for CGS sample SCGS and the magnetoelectric coupling sample SME, and the interaction mechanism of magnetoelectric coupling between CGS film and PZN-PT. The composition distribution of SME is marked in the inset of Figure 1b using a red short-dashed box.

