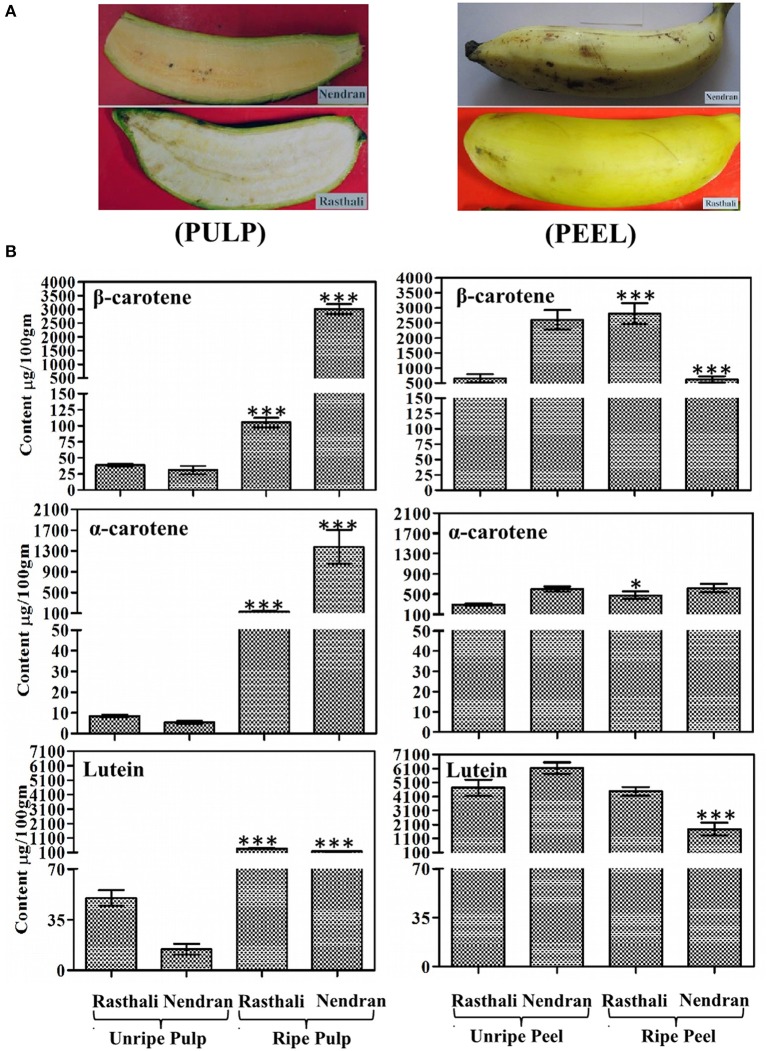
Figure 1.
Qualitative and quantitative assessment of carotenoids in fruit tissues of Nendran and Rasthali banana cultivars. (A) Visual observation of ripe fruit-pulp and -peel. (B) Carotenoid profiling in ripe and unripe fruit tissues. Bars denote mean of carotenoid content ± SD. Compounds were quantified by separating extracts from the peel and pulp using HPLC. HPLC chromatograms are given in Supplementary Figures S2, S3. Statistical analysis was performed using Student's paired t-test. Statistical significance was checked at P ≤ 0.05–0.001 (*P ≤ 0.05; ***P ≤ 0.0001) with respect to the unripe- versus ripe-pulp/peel of Rasthali and Nendran.

