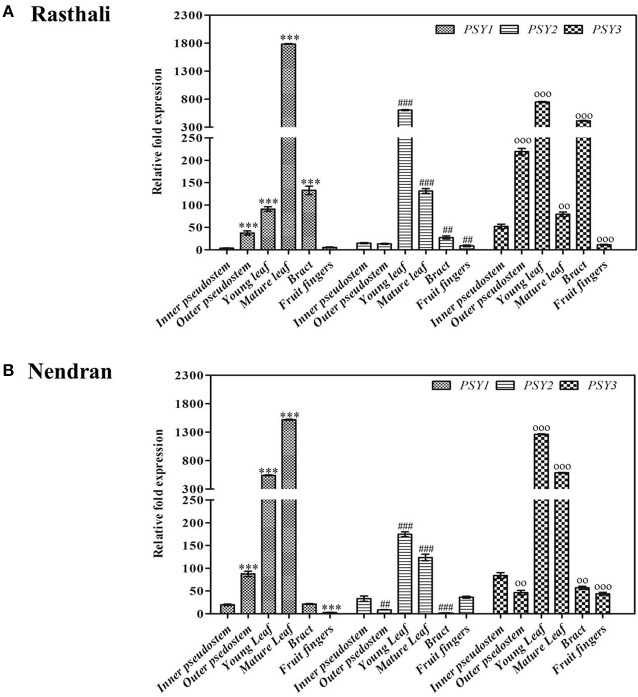
Figure 2.
Spatiotemporal real-time PCR expression analysis of PSY genes in banana vegetative tissues. Transcript expression profiles are presented in pseudostem (inner, and outer), leaf developmental stages (young, and mature), bract, and fruit fingers of Rasthali (A), and Nendran (B). The gene expression was normalized with reference to actin1 taken as internal control. Bars denote mean fold expression as compared to the lowest expressing gene in the group of samples ± SD. Statistical analysis was performed using Student's paired t-test. Statistical significance was checked at P ≤ 0.05–0.001 and the symbols on the top of bars represents significance levels (##, oo, P ≤ 0.001; and ***, ###, ooo, P ≤ 0.0001) with respect to inner pseudostem in each group.

