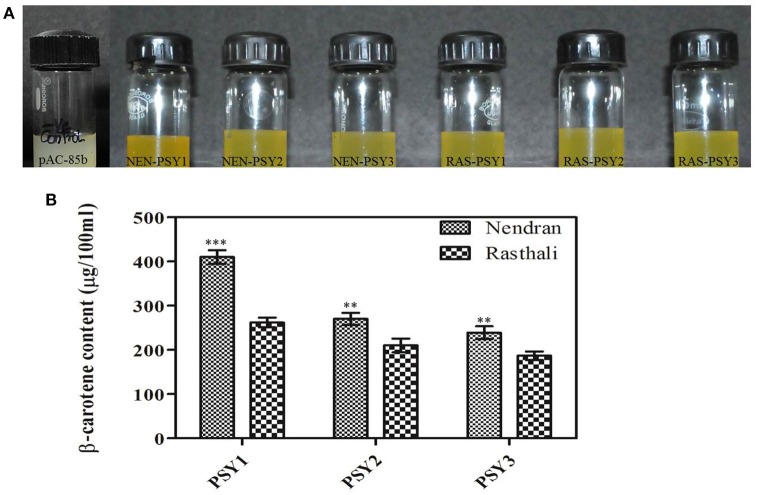
Figure 7.
Functional complementation analysis. (A) Color phenotype of E. coli cultures consisting of pAC-85b (control) and complemented with plasmids containing PSY homologs (NEN-PSY1-3 and RAS-PSY1-3). (B) Concentration of β-carotene in E. coli cells after complementation with plasmids pAC-85b and pTrc containing PSY1-3 of Nendran and Rasthali. Bars denote mean of β-carotene content ± SD. Statistical significance was checked at P ≤ 0.05–0.001 (** significant; *** highly significant) with respect to the Rasthali (PSY1-3).

