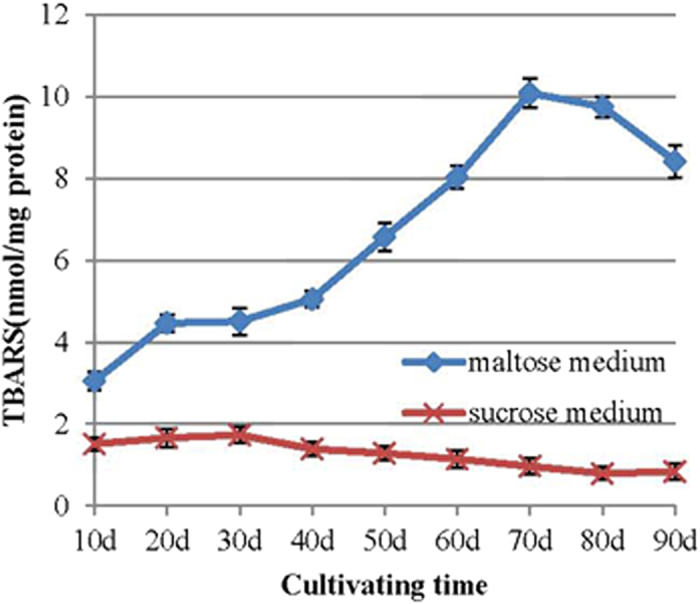
Figure 1. TBARS levels of the mycelia in the maltose and sucrose media.

The independent T-test was used to analyse the data of the two groups for each cultivation phase. Mean values ± SD or representatives of at least three independent experiments are shown (n = 30).
