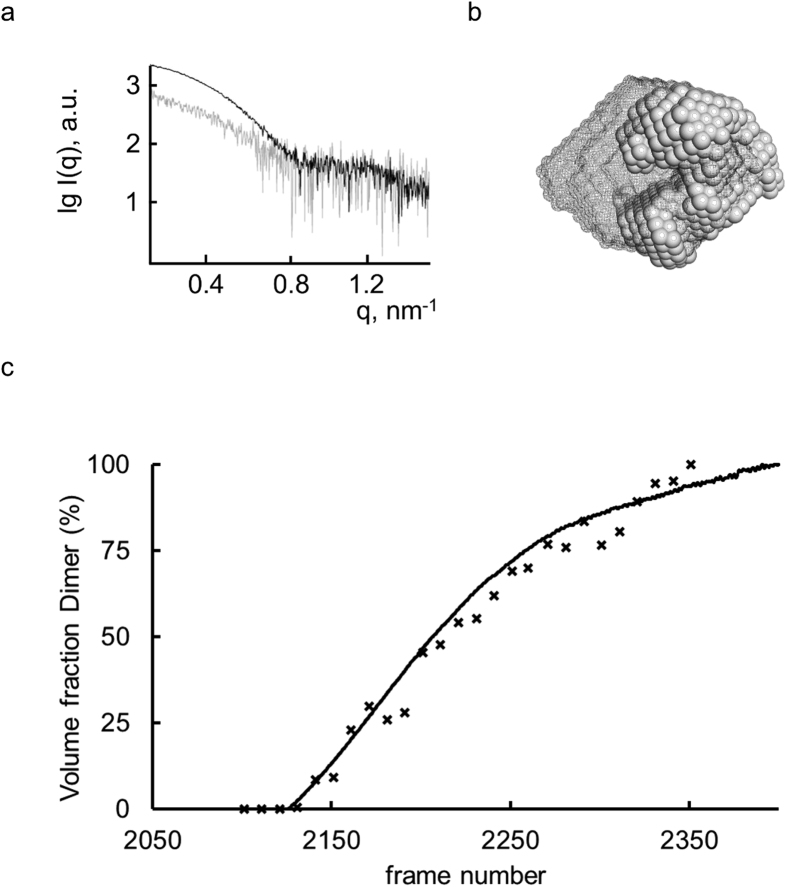
Figure 3. Analysis of dimeric PlaB with SAXS and TDA data.
(a) SAXS scattering profiles of Lpn-PlaB collected from the tetrameric fraction (black, frames 2000-2160) and dimeric fraction (gray, frames 2350-2360). (b) 3D reconstructions of the tetrameric fraction (dark mesh) and bead model of the dimer fraction (gray). For these, the SAXS profiles shown in (a) were merged with data collected at higher concentration in batch mode (4.5 mg/ml, Fig. 2d) and 10 runs of DAMMIF were performed to generate a starting model for a final run of DAMMIN. (c) Estimation of the volume fraction of PlaB dimeric species. The volume fraction of the dimeric component in the respective SAXS frames was determined with Oligomer (crosses). For this 10 frames were averaged and fitted by distinct ratios of the form factors derived from the scattering profiles corresponding to the tetrameric and dimeric species as shown in (a). This coincides very well with the volume fractions derived from the TDA data (black curve); the % volume fraction of dimeric species was determined by the ratio (MWtetramer – MWRALS) to MWdimer.

