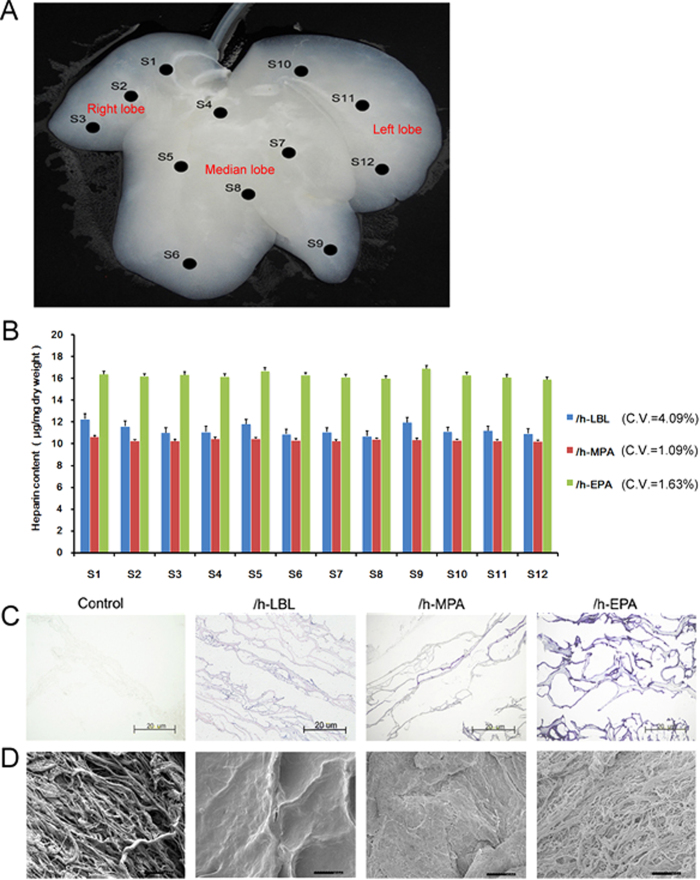
Figure 3. Whole-organ decellularized porcine liver homogeneous heparin immobilization.
(A) Samples were taken from 12 different sites (S1 to S12) of DLS different lobes. (B) The heparin content results of S1 to S12 from each liver with different heparin treatments, the coefficients of variations (CV %) for three methods were 4.09% (LBL), 1.09% (MPA) and 1.63% (EPA) respectively; values are expressed as means ± SD, n = 3. (C) TB staining of heparin immobilized on DLSs, blue staining is positive for heparin immobilization. (D) SEM micrographs of heparin immobilized on DLSs. (C) and (D) from left to right: control, /h-LBL, /h-MPA, and /h-EPA. Scale bars: 20 μm.

