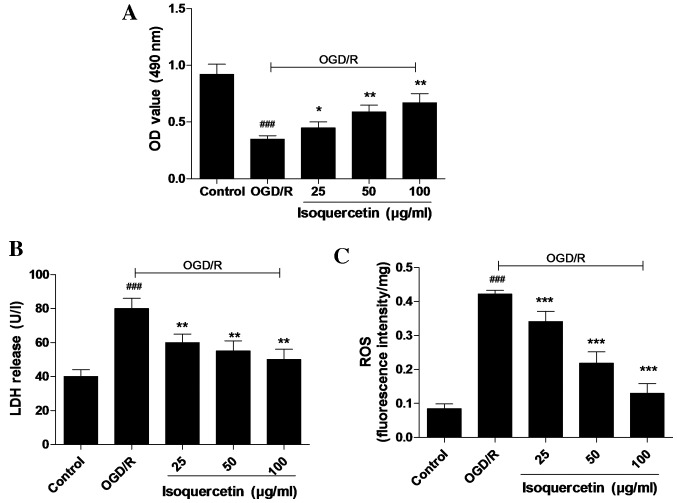
Figure 3.
Effects of different concentrations of isoquercetin on primary cultures of rat hippocampal neurons after OGD/R. (A) Cell viability was determined by MTT assay, and (B) LDH release and (C) ROS levels were measured. Data are shown as the mean ± standard error of the mean (n=6). *P<0.05, **P<0.01 and ***P<0.001 vs. the OGD/R group; ###P<0.001 vs. the control group. OGD/R, oxygen-glucose deprivation followed by reoxygenation; MTT, 3-(4,5-dimethylthiazol-2-yl)-2,5-diphenyltetrazolium bromide; LDH, lactate dehydrogenase; ROS, reactive oxygen species; OD, optical density.

