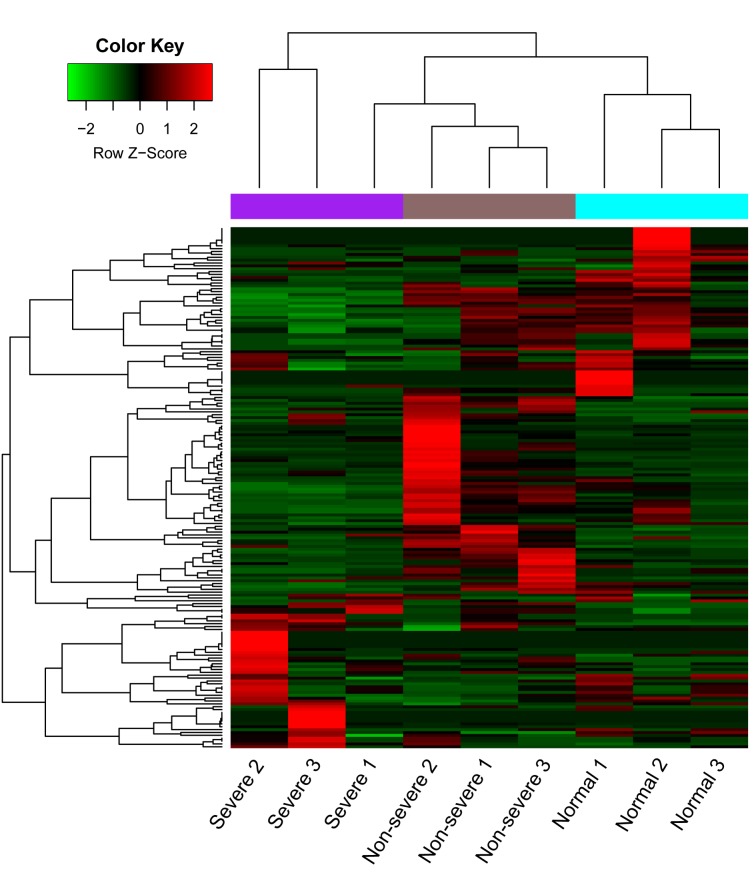
Figure 3.
Heatmap from clustering analysis of DE-miRs in the plasma of the peripheral blood of the severe pneumonia, non-severe pneumonia and control groups. The x-axis denotes samples and the y-axis denotes miRNA. The Z-score indicates the parameter used for the calculation of miRNA expression based on raw reads. A value of >0 was deemed to indicate upregulation (red) and a value <0 was deemed to indicate downregulation (green). The purple, brown and blue panels at the top of the heat map indicate severe, non-severe and control samples, respectively. DE-miRs, differentially expressed microRNAs.

