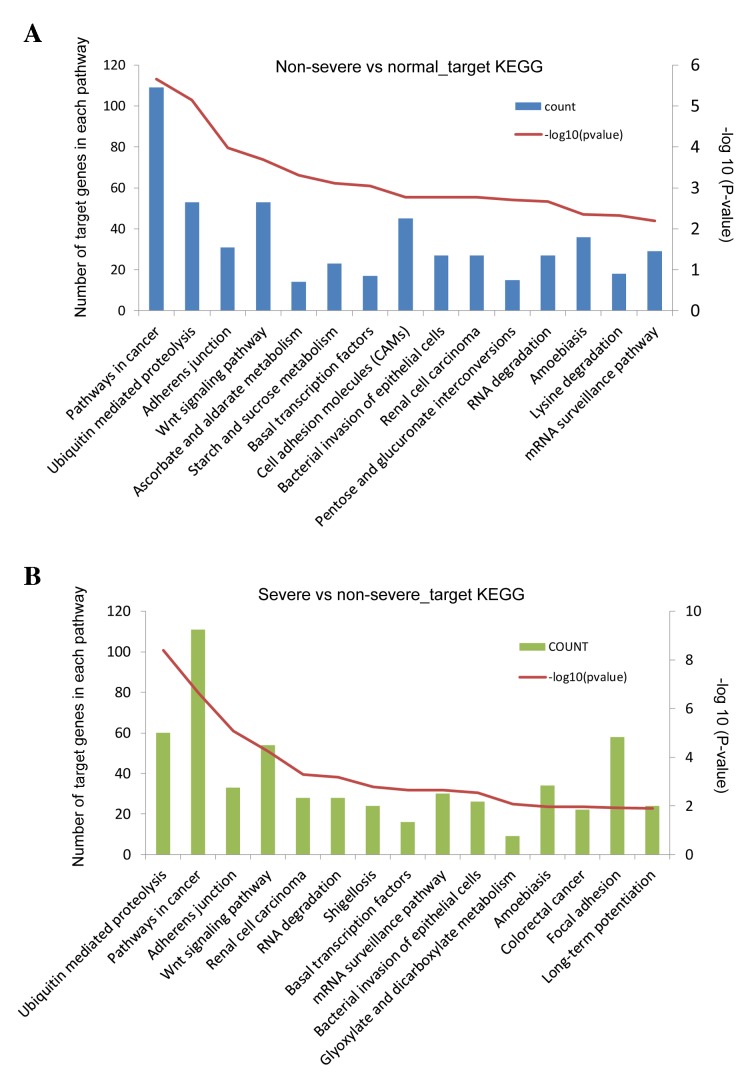
Figure 4.
Enrichment analysis of key DE-miR target genes from comparisons of (A) non-severe pneumonia and control groups, and (B) severe and non-severe pneumonia groups. DE-miR, differentially expressed microRNA. -log10(P-value) represents the significance of the enriched pathway and was used to quantify and present the results more clearly. P-values were calculated following pathway enrichment and P<0.05 was identified as the threshold for significant pathway selection.

