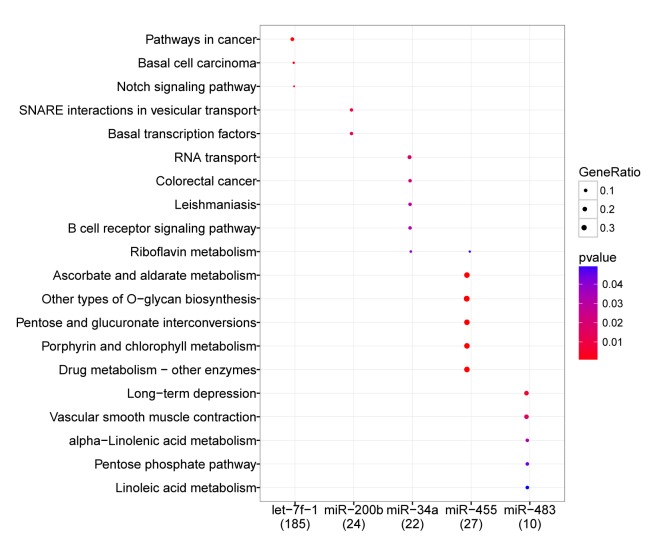
Figure 5.
Enrichment analysis of the key DE-miRs. Names on the left are the pathway categories of the target genes. The circles of different sizes represent GeneRio, the ratio of the ‘number of target genes enriched in a specific pathway’ to the ‘number of total genes in the pathway’. Different colors represent the P-values of the significance of different pathways, compared with the reference species. The numbers in brackets underneath the miRNA names indicate the numbers of identified genes in each pathway category. DE-miRs, differentially expressed microRNAs.

