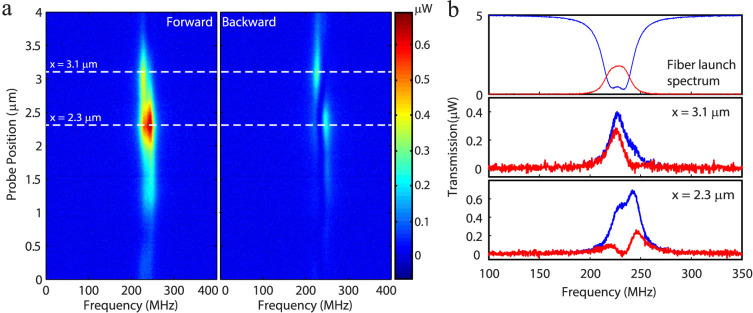
Figure 3. Mode spectra of a WGMR with incident beam spot at different positions.
(a), Spectrograms of light coupled out of the WGMR by a fiber taper in the forward and backward directions when a tightly focused free-space beam spot was scanned along the equator of the microtorid with nanocouplers. The size of beam spot was about 5 μm. The input power of free space laser beam was about 5 mW, and wavelength is in 1550 nm band. (b), Light coupled out from the microtoroid via a fiber taper when the same fiber taper was used to couple light into the microtoroid(top panel) and when free-space light is coupled into the microtoroid via the nanocouplers within the beam spot size (middle and bottom panels). The transmission spectra in the middle and bottom panels correspond to the probe positions of 3.1 μm and 2.3 μm in (a). Different probe positions yield distinctively different spectra. Blue and red curves denote the transmission spectra in the forward and backward directions, respectively.

