Figure 3.
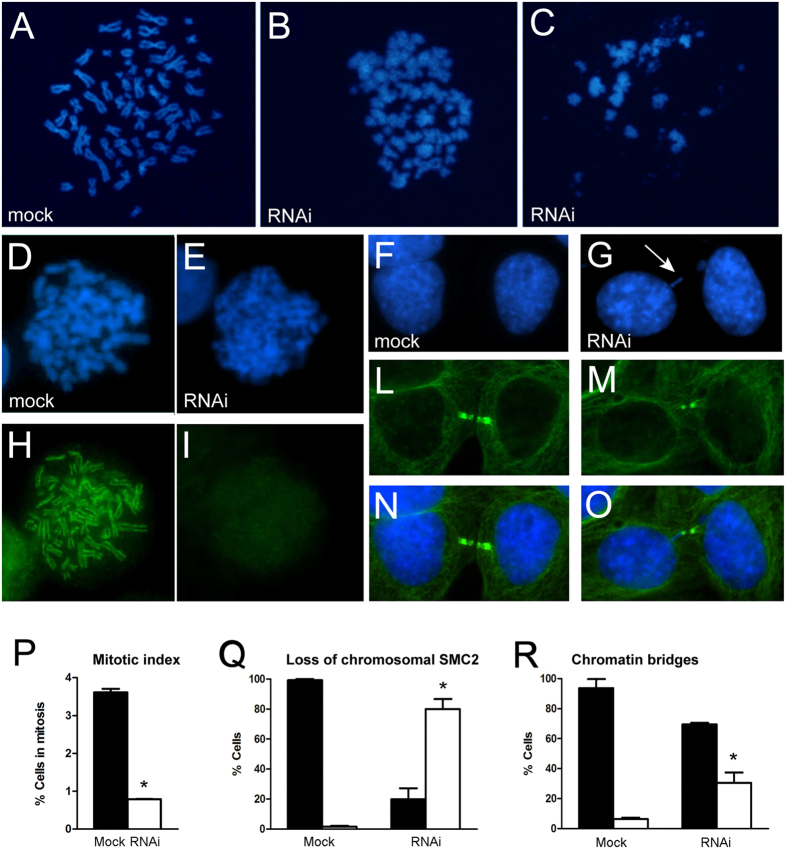
Mitotic defects after RNAi depletion of CFDP1 in HeLa cells (A) Metaphase chromosomes from mock-treated HeLa cells; (B) and (C) Clearly aberrant metaphase chromosomes that fail to undergo proper condensation found in RNAi treated HeLa cells; condensing chromatin appeared fuzzy, loose and largely disorganized. Hela cells were treated with Colcemid to enrich for metaphase chromosomes. (D) and (E) DAPI and SMC2 condensin sequential staining of mock treated cells; the SMC2 staining decorates the chromatid axes (H) and (I) DAPI and SMC2 condensin sequential staining of CFDP1 depleted cells; the SMC2 staining is very faint. (F) and (L) DAPI and α-tubulin staining of telophases in mock-treated cells; (N) Merge; (G) and (M) DAPI and α-tubulin staining of telophases in CFDP1 depleted cells; (O) Merges. The arrow in (G) points an example of chromatin bridge. (P) Quantification of the mitotic index of CFDP1 depleted cells compared to the mock. The mitotic index is expressed as the percentage of the total population of cells in mitosis (n = 1000). Cell cycle stages were determined by scoring all mitotic cells by IF for α-tubulin and chromosome staining; black and white histograms represent % of cells in mitosis in mock and CFDP1-depleted cells, respectively. (Q) Quantification of loss of chromosomal SMC2 in CFDP1-depleted cells compared to the mock; black and white histograms represent % of cells with normal or aberrant distribution of SMC2 respectively. (R) Quantification of telophases showing chromatin bridges in CFDP1 depleted cells compared to the mock. About 30% of telophases show the occurrence of chromatin bridges. Black and white histograms represent % of normal and aberrant telophases in mock and CFDP1-depleted cells, respectively.

