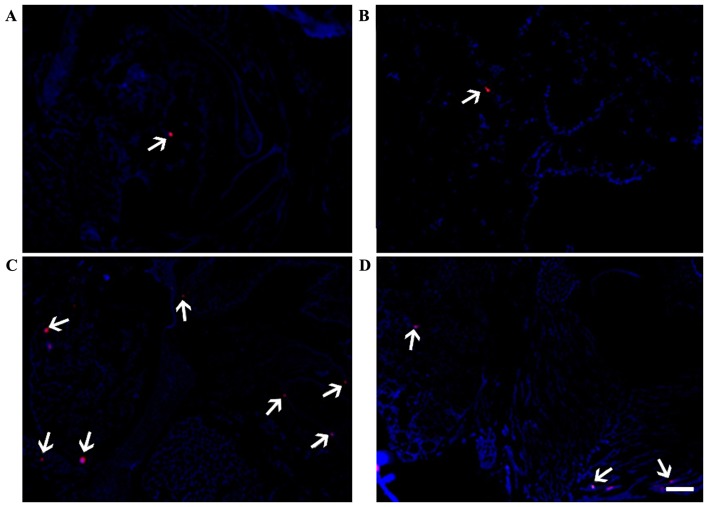
Figure 7.
Nesting of CM-DiI-labeled MSCs in thyroid gland tissue observed via fluorescence microscopy (magnification, ×400). White arrows indicate the presence of red fluorescence and therefore MSCs. (A) C3H10T1/2/MSC group; (B) C3H10T1/2-MIGR1/MSC group; (C) C3H10T1/2-MIGR1-intercellular adhesion molecule-1/MSC group; (D) MSC group. The scale bar reperesents 250 µm. MSC, mesenchymal stem cells.

