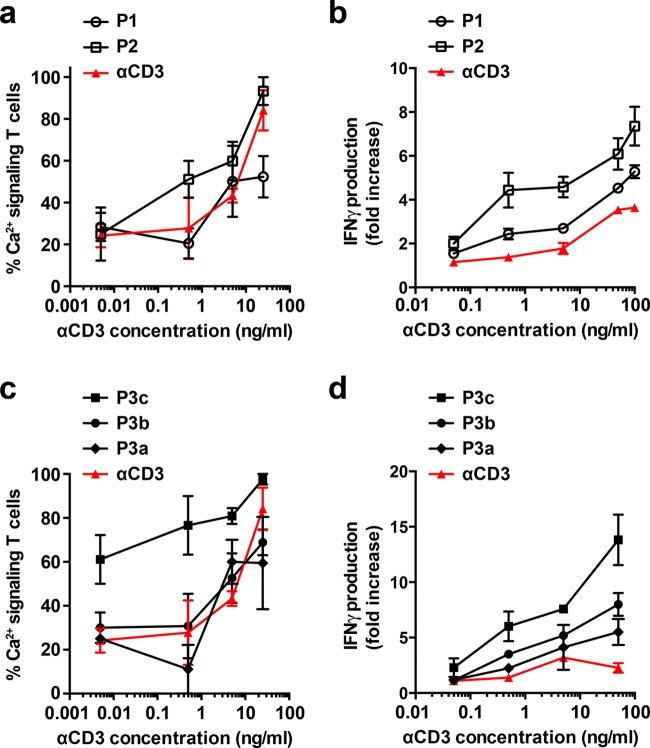
Figure 2.
T-cell activation using sDCs of different length and αCD3 density. (a) Fraction of activated PBLs as determined from single-cell Ca2+-signaling measurements performed during the first hour of stimulation with P1, P2, and free αCD3. (b) Relative increase in the concentration of IFNγ secreted by PBLs treated with P1, P2, and free αCD3 for 16 h. Untreated PBLs were used as a reference. (c) Fraction of activated PBLs as determined from single-cell Ca2+-signaling measurements performed during the first hour of stimulation with P3a–c, and free αCD3. (d) Relative increase in the concentration of IFNγ secreted by PBLs treated with P3a–c, and free αCD3 for 16 h. Untreated PBLs were used as a reference. For (a)–(c), the data represent the mean ± SEM of three independent experiments performed with T cells from different donors. For (d), the data represent the mean ± SEM of two independent experiments performed with T cells from different donors. The number of cells analyzed in the single-cell Ca2+-signaling experiments (a, c) is summarized in Table S4.

