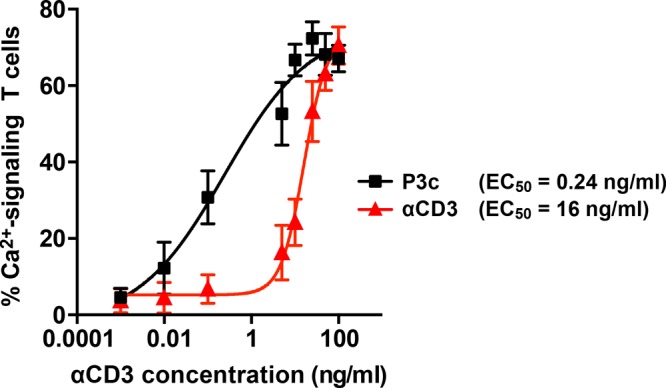
Figure 3.

Dose–response curves for PBLs treated with P3c and free αCD3 as determined from single-cell Ca2+-signaling experiments. EC50 values were determined using a four-parameter fit. The multivalent enhancement factor is calculated by dividing the EC50 of free αCD3 by the EC50 of P3c. The data represent the mean ± SEM of three independent experiments performed with PBLs from different donors. The number of cells analyzed is summarized in Table S4.
