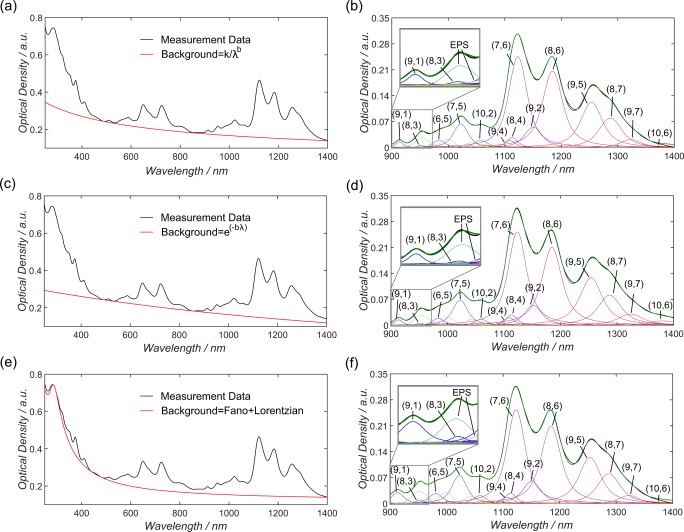
Figure 1.
Three different background subtraction methods proposed by Nair et al. (a), Naumov et al. (c), and Tian et al. (e).39−41 The measured absorption spectra are shown in black and the background profiles in red. The different background subtraction techniques result in comparable (n, m) distributions for shorter wavelengths in (b) and (d) but clearly deviate for (f). Above 1300 nm, (b) and (f) are comparable, whereas (d) clearly deviates, e.g., in the contribution of (9, 7) or (10, 6). A representative PL measurement is shown in Figure S1.

