
Figure 3.
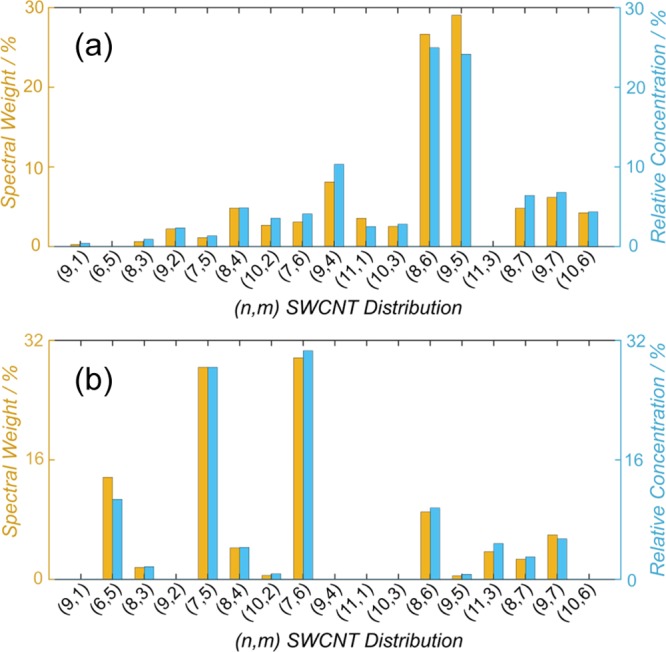
Histograms showing the (n, m) abundance of two different polychiral solutions (a) and (b), shown in Figure S9. The data is presented as both spectral weight and relative concentration.
Official websites use .gov
A
.gov website belongs to an official
government organization in the United States.
Secure .gov websites use HTTPS
A lock (
) or https:// means you've safely
connected to the .gov website. Share sensitive
information only on official, secure websites.
Histograms showing the (n, m) abundance of two different polychiral solutions (a) and (b), shown in Figure S9. The data is presented as both spectral weight and relative concentration.