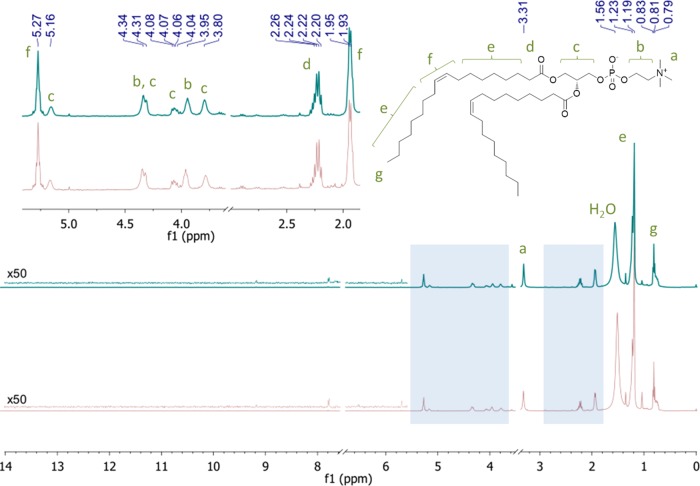
Figure 6.
1H NMR spectra of lipids extracted from electroformed GUVs (top trace) and large multilamellar vesicles (LMVs) (bottom trace). The residual solvent peaks of chloroform (7.26 ppm) and methanol (3.49 ppm) were removed for clarity. The inset shows a magnified view of the olefinic and head group protons.

