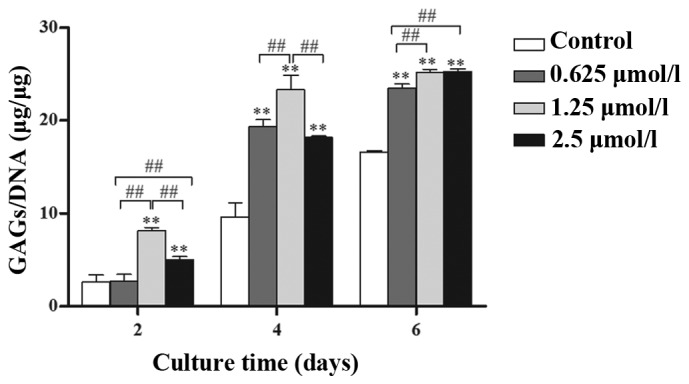
Figure 4.

Quantified matrix production by GAGs (µg) normalized to DNA (µg). Chondrocytes were cultured in vitro with 0 (control), 0.625, 1.25 and 2.5 µmol/l baicalin for 2, 4 and 6 days. Data from four independent experiments were evaluated and the mean ± standard deviation is indicated. **P<0.01 vs. the control group. ##P<0.01 between the indicated experimental groups.
