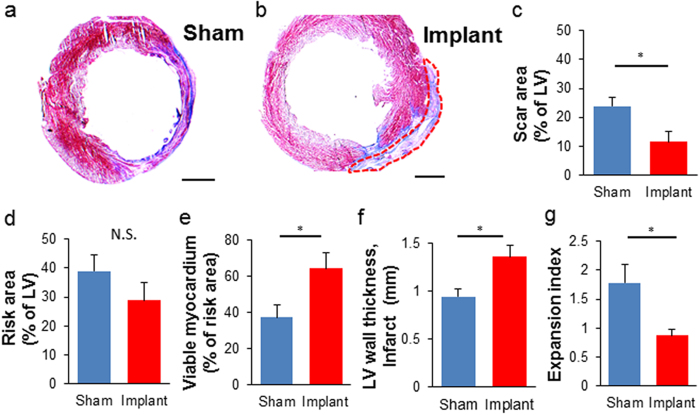
Figure 6. Morphometric analysis of LV remodelling after hiPSC-ME-ECTs cardiac implantation.
Representative Masson’s trichrome staining of (a) sham treated and (b) ME-ECT implanted rat hearts at W4. Scale bar: 2 mm. Red dotted line indicates engrafted area (c) Scar area (% of LV), (d) Risk area (% of LV), (e) Viable myocardium (% of risk area), (f) LV wall thickness at the infarct (mm), and (g) Expansion index after ME-ECT implantation (*P < 0.05, N.S., not significant). Expansion index = (endocardial circumference/epicardial circumference) × (non-infarcted region wall thickness/risk region wall thickness). Multiple indices support reduced scar and increased viable myocardium after hiPSC-ME-ECT implantation [n = 5 (Implant) and 5 (Sham)].

