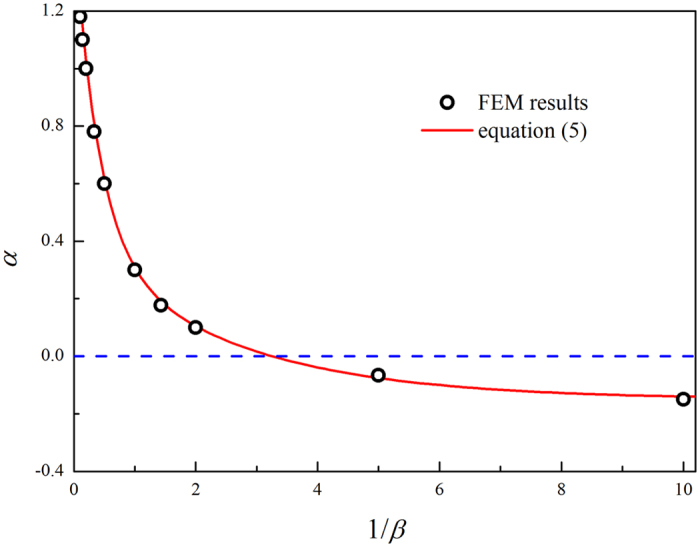
Figure 3. Values of α for different ratios β of indenter radius to cell radius.

The symbols represent the fitting parameter obtained from equation (4). The solid line is plotted by equation (5), which is in good agreement with the symbols.

The symbols represent the fitting parameter obtained from equation (4). The solid line is plotted by equation (5), which is in good agreement with the symbols.