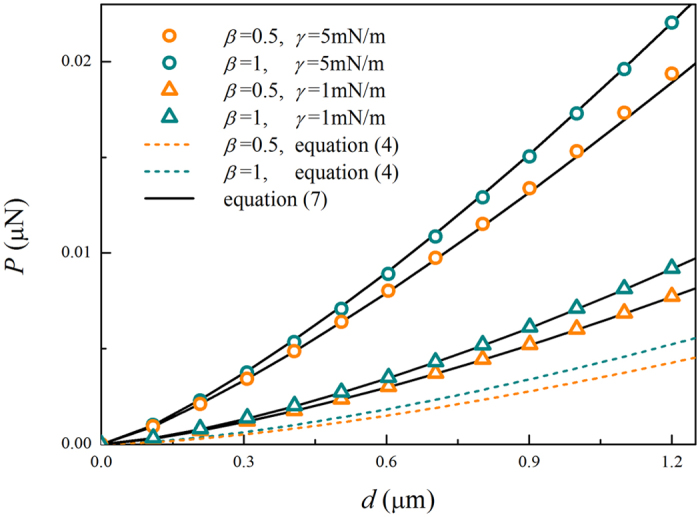
Figure 4. Load-depth curves affected by the surface energy for two indenter radii.

The symbols are from the FEM results with considering surface energy and can be predicted by equation (7) (see solid lines). The dashed lines represent the results without surface energy obtained from equation (4).
