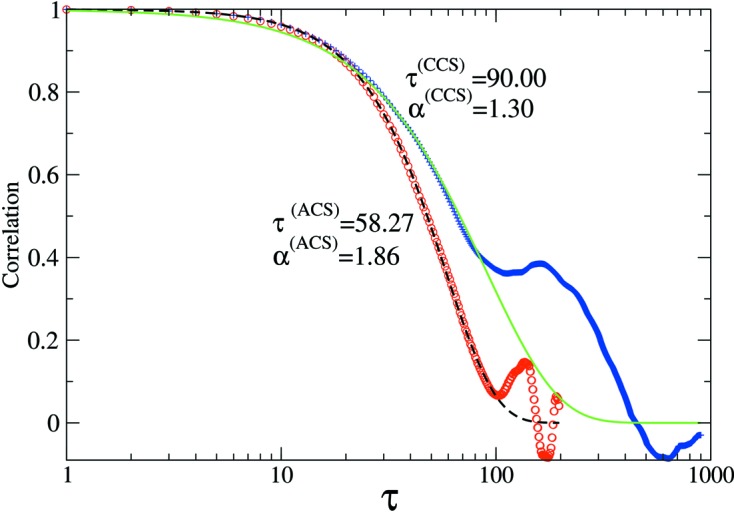
Figure 7.

Example of one-time correlation functions at  extracted from the 2-TCF of Fig. 6 ▸ using the convention of Brown et al. (1997 ▸) (open red circles) and the new convention proposed here (blue crosses). The dashed (black) and solid (green) lines have been obtained by fitting the one-time correlation data with the function
  , where τ is the correlation time and α the Kolhrausch–Williams–Watts exponent (Madsen et al., 2010 ▸). For the fits, only the data up to
  have been considered.
