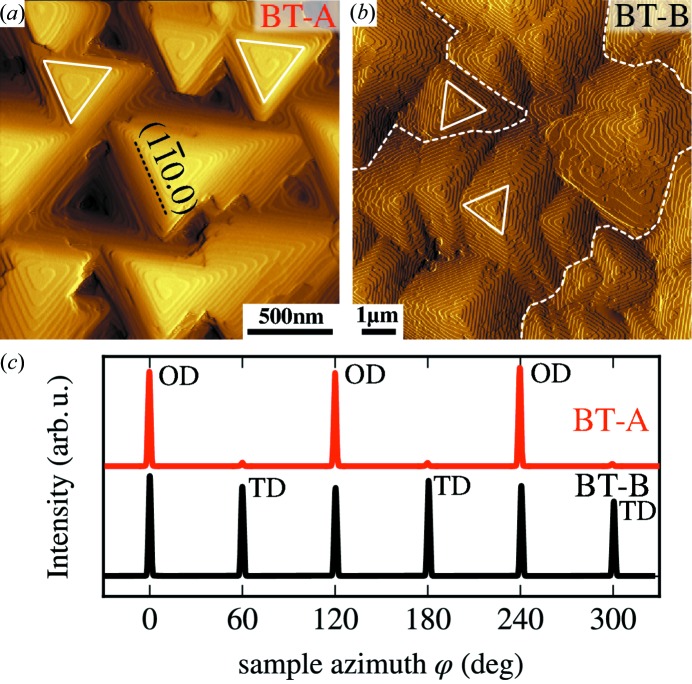
Figure 2.
Surface characterization by AFM (a), (b) and large-area XRD azimuthal scans (c) of Bi2Te3 samples BT-A and BT-B. Both samples show triangular pyramids on the surface; however, for sample BT-B the pyramids show two orientations different by 60/180°. The lattice plane indices of the preferred surface step orientation are indicated in (a). White dashed lines in (b) mark the boundary between areas with the two distinct orientations. (c) XRD azimuth scans of the ( ) Bragg peak, which has a threefold symmetry according to the crystal structure, show that sample BT-A from panel (a) (red) indeed shows this threefold symmetry, while sample BT-B (black) shows a sixfold symmetry. For the X-ray measurements the signal from an area of ∼4 mm2 is averaged. The origin of the Bragg peaks from the ordinary domains and twin domains is indicated by OD and TD, respectively.

