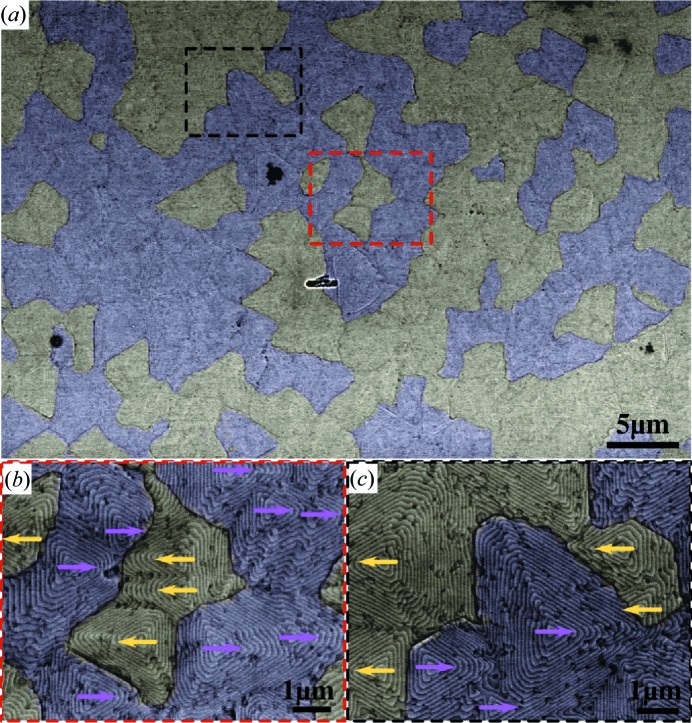
Figure 4.
Surface morphology and twin domain correlation. (a) Scanning electron micrograph of sample BT-B overlaid with a semi-transparent representation of the EBSD crystal orientation data. The crystal orientation indicates the direction of the in-plane a direction/[ ] and in agreement with our XRD data finds only two types of orientations, i.e. the two twin orientations. The twin domain boundaries are correlated with the surface structure. Panels (b) and (c) whose location is indicated in panel (a) show enlarged details confirming this correlation. For clarity, arrows mark the orientation of the pyramids.

