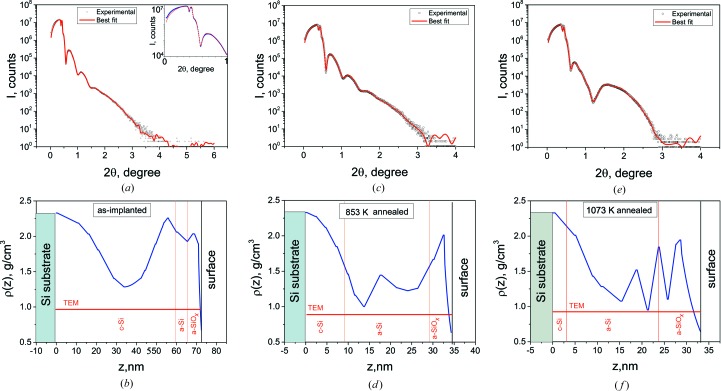
Figure 5.
X-ray specular scattering and best-fit curves (a), (c), (e) and mass density profiles (b), (d), (f): (a), (b) as-implanted, (c), (d) annealed at 853 K and (e), (f) annealed at 1073 K. The inset in (a) shows part of the experimental curve in the vicinity of the critical angle. Information on layer thickness obtained by TEM is added for comparison.

