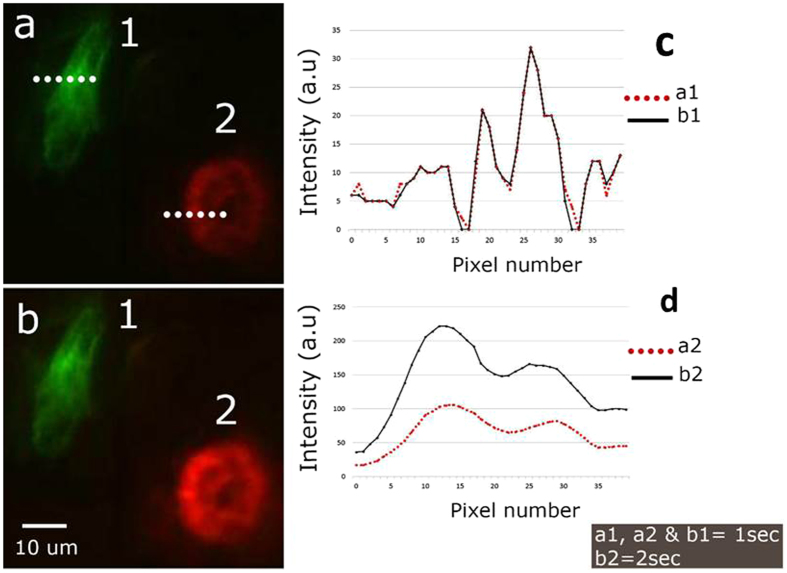
Figure 5. Targeted time averaged imaging of mouse kidney section.
Cell 1 is illuminated with 488 nm, and cell 2 is illuminated with 561 nm. (a) Image acquired by illuminating cell 1 and cell 2 for 1 sec each. (b) Image acquired by illuminating cell 1 and cell 2 for 1 sec and 2 sec respectively. (c and d) Intensity variation across the line marked on cell 1 and cell 2 respectively.

