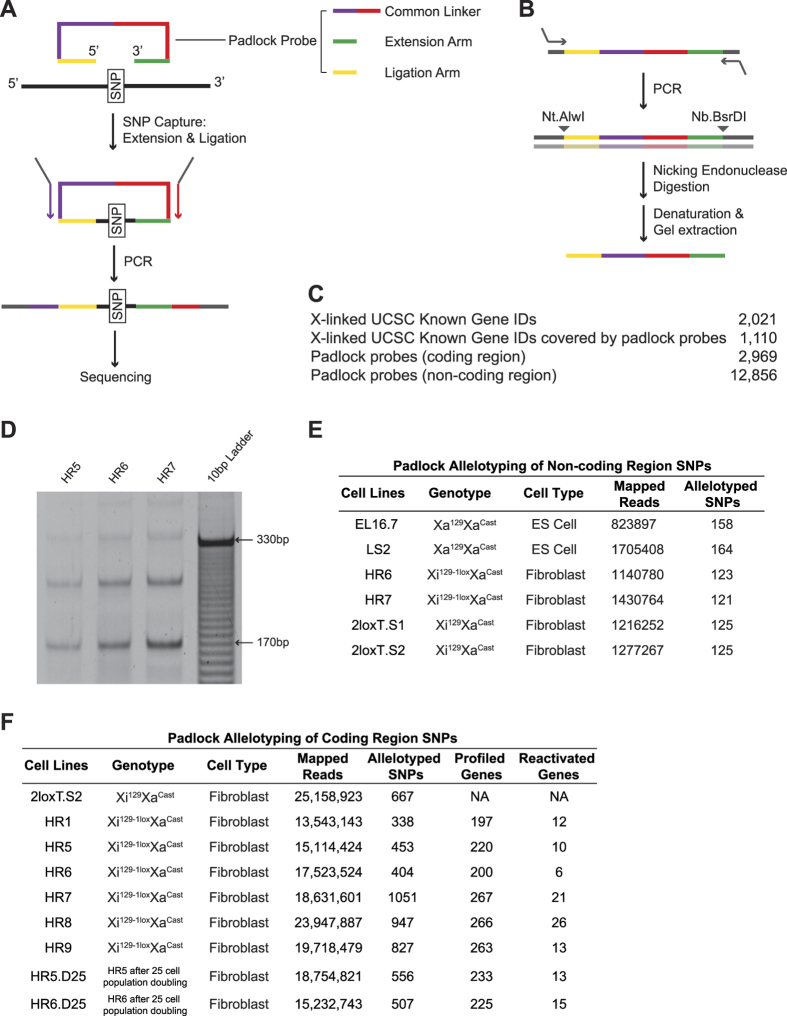
Figure 1. Padlock SNP capture.
(A) Scheme of SNP capture using padlock probes. (B) Diagram of padlock probe library amplification. (C) Summary of padlock probe library design. (D) PCR amplification of the circular DNA molecules generated in padlock probe SNP capture. The DNA bands showed the expected amplicon sizes. The ~175 bp band was subjected to Solexa sequencing. The ~255 bp, ~345 bp and ~435 bp bands correspond to PCR extension around the circular DNA templates (a unique feature of the padlock capture products) 2, 3 and 4 times. (E,F) Summary of the Solexa sequencing data.

