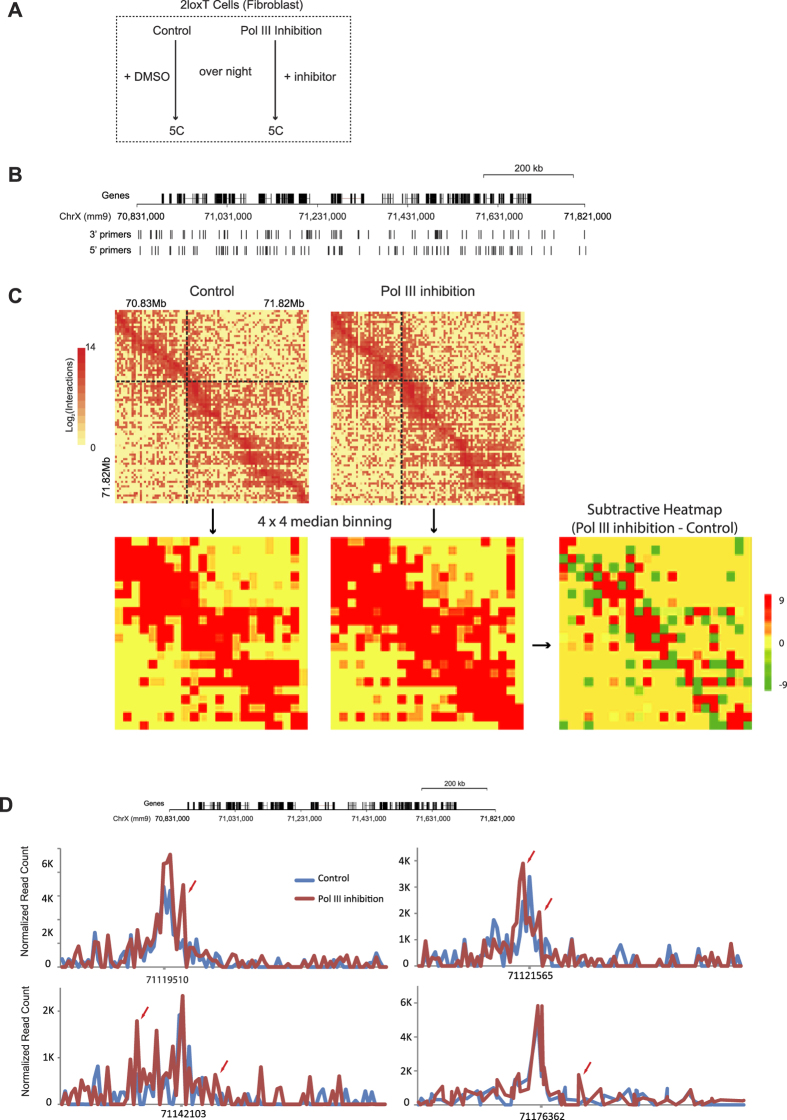
Figure 5. Pol III inhibition causes chromatin conformation change.
(A) The experimental design. (B) The ~1 mb region along the mouse X chromosome selected for 5 C analysis. (C) Heatmaps showing all the chromatin interactions detected in each sample. The two dashed lines drawn in the control sample heatmap mark the boundaries of the two topologically associating domains (TAD) detected in the control sample. To show the difference of chromatin interaction between the two samples, a subtractive heatmap was generated by subtracting the interaction count of the control sample from the interaction count of the Pol III inhibition sample. (D) Chromatin interaction profiles of four selected anchor points.

