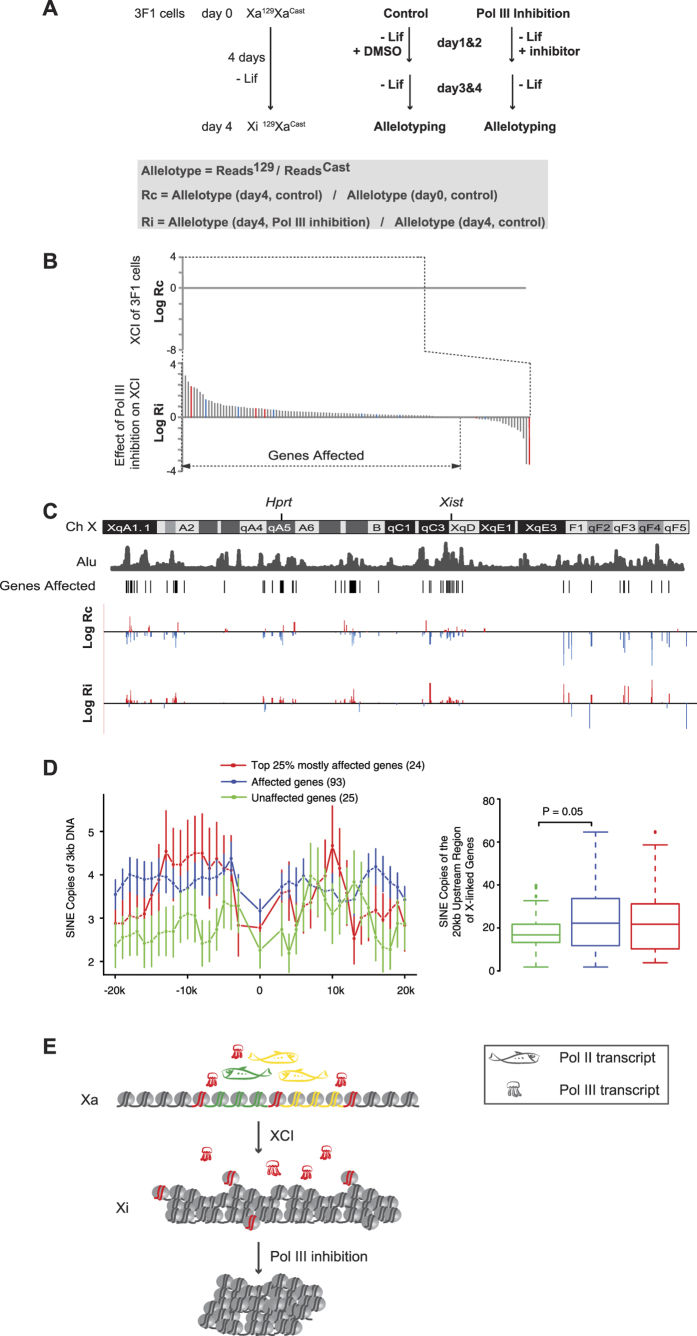
Figure 6. Pol III inhibition impairs XCI in vitro.
(A) The experimental design. (B) The effect of Pol III inhibition on the XCI of 3F1 cells in vitro. X-linked genes were sorted according to their corresponding values on the y-axis. The constitutive escapees10 of XCI are highlighted in red. The facultative escapees11 of XCI are highlighted in blue. Note: Genes are sorted along the x-axis according to Rc or Ri values. Readers are referred to panel C for the corresponding values of Rc and Ri of each gene. (C) The distribution pattern of the X-linked genes affected by Pol III inhibition. The Log Rc and Log Ri values of the X-linked genes are plotted along the X chromosome at the corresponding position of each gene. (D) Distribution of SINE elements along the X-linked genes. The 20 kb upstream and the 20 kb downstream regions of each X-linked gene were scanned by a sliding window of 3 kb with a step size of 1 kb. The average copy number of a repetitive element within a 3 kb intronic region of a gene is used to represent the density of the repetitive element within the gene body. Data are shown as mean ± S.E.M. Box plots show the of copy number of SINE elements within 20 kb upstream of X-linked genes. (E) A model of Pol III transcription from noncoding regions regulating the chromatin configuration.

