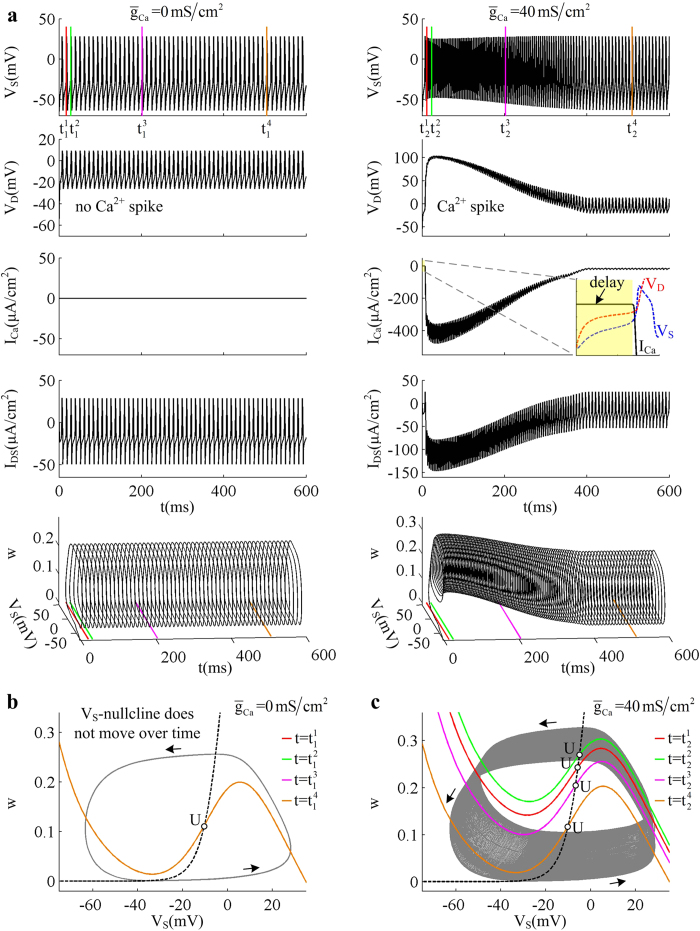
Figure 3. Spike initiating dynamics evoked by dendritic input.
(a) Sample responses of the 5D model with  and
and  . Somatic voltage VS, dendritic voltage VD, dendritic Ca2+ current ICa, and internal current IDS are plotted against time. The close-up shows that the Ca2+ conductance is activated when dendritic voltage VD exceeds a threshold value. The sample response is also plotted in
  space (bottom panel). Color lines indicate the times at which the nullclines in (b) and (c) are calculated. Here dendritic input is
  . (b) Two-dimensional phase portraits in
  plane for
  . (c) Phase portraits in
  plane for
  . For (b) and (c), the VS- and w-nullclines are respectively calculated at four time points indicated by colored lines in (a). Black dotted lines represent w-nullclines, which are the same at different time points. The inverted N-shape lines with other colors are the VS-nullcline at the corresponding time point indicated in (a). With
  , the VS-nullcline does not move over time. Gray solid line is the sample VS trajectory of the recorded spike trains, and black arrows indicate the direction of its motion. ‘U’ indicates unstable fixed point. Somatic injection is
  .
.

