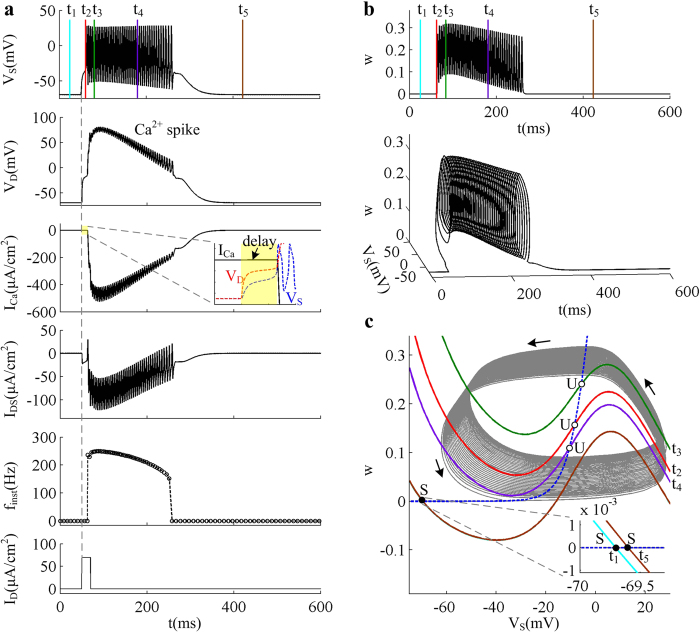
Figure 7. Somatic APs and initiating dynamics evoked by pulse injected at dendritic chamber.
(a) Sample responses of the 5D model triggered by pulse input ID in the cases of  . Somatic voltage VS, dendritic voltage VD, dendritic Ca2+ current ICa, internal current IDS, and instantaneous firing rate finst are plotted against time. The amplitude of ID is
  and its duration is 20 ms. (b) Plot of K+ activation variable w against time with
  . The spike train recorded in soma is also plotted in
  space. Five color lines in panel (a) and (b) indicate the times at which the nullclines are calculated. (c) Two-dimensional phase portraits in
  plane. The VS- and w-nullclines are respectively calculated at time point t1 − t5 indicated by colored lines in (a) and (b). Blue dotted line represents w-nullcline, and the inverted N-shape lines are the VS-nullclines at corresponding time point. Gray solid line is the VS trajectory, and black arrows indicate its direction. ‘S’ indicates stable fixed point, and ‘U’ indicates unstable fixed point. Somatic injection is
  .
.

