
Figure 3.
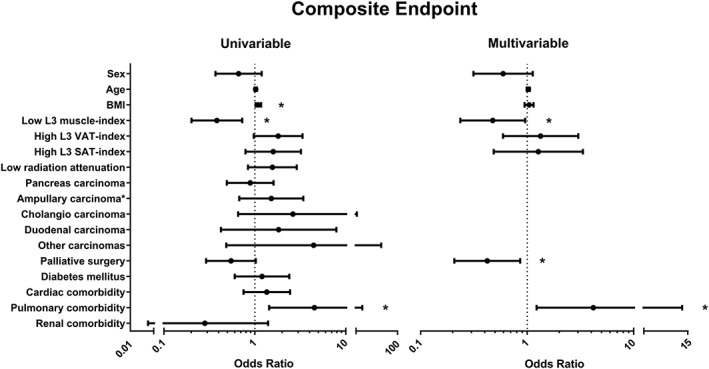
Association between computed tomography scan measurements and potential confounders with post‐operative complications using logistic regression analysis. Values are displayed as odds ratio and 95% confidence interval. Sex, age, body mass index (BMI), and variables that generated a P‐value of <0.1 in a univariable analysis were entered in the multivariable analysis. C‐statistic = 0.72 for multivariable analysis. SAT, subcutaneous adipose tissue; VAT, visceral adipose tissue. *P < 0.05.