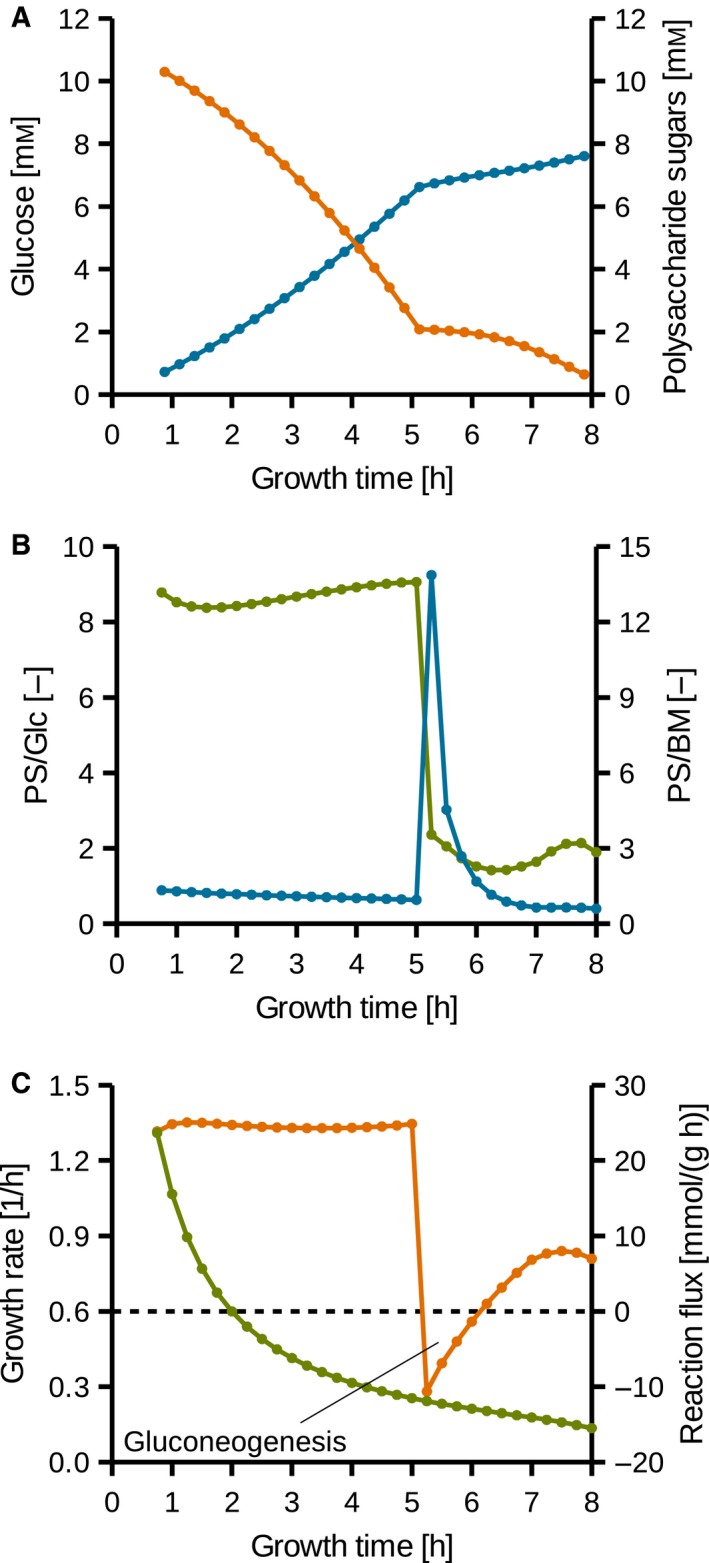
Figure 4.

Growth of C. difficile 630Δerm in MDM. (A) Orange: glucose concentration used for the simulations, blue: predicted exopolysaccharide concentration. (B) Blue: predicted ratio of polysaccharide sugar secretion rate and glucose uptake rate (PS/Glc), green: predicted ratio of polysaccharide carbon secretion rate and biomass carbon production rate (PS/BM). (C) Green: growth rate based on OD, orange: predicted reaction flux catalyzed by the phosphoglycerate kinase (EC 2.7.2.3) per biomass.
