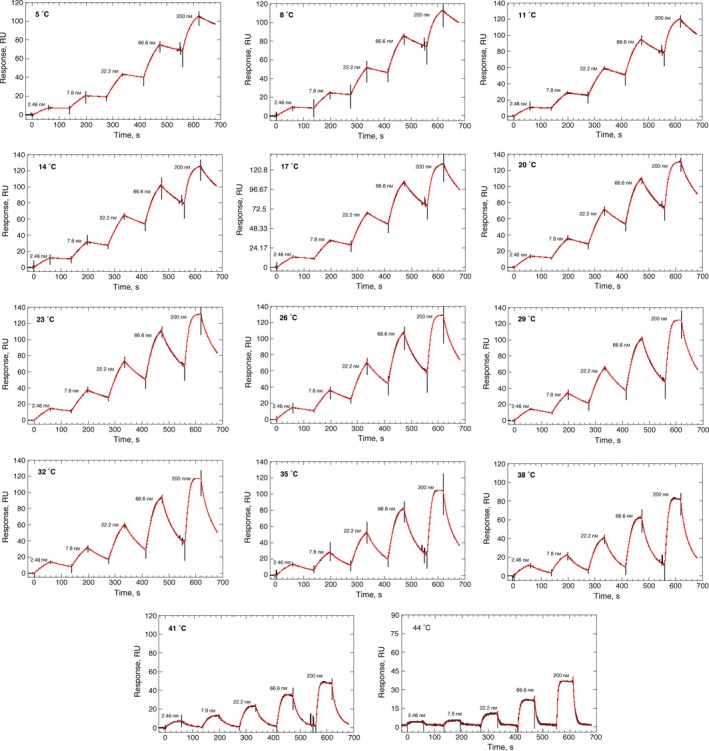
Figure 3.

Effect of temperature on the binding of CsA to His‐CypA. Reference corrected SPR single‐cycle kinetic sensorgrams (black), monitored on a surface with 2378 RU of covalently stabilised His‐CypA (250 nm, 30‐s contact following 180‐s activation) for the indicated CsA concentrations (200–2.46 nm) from 5 °C to 44 °C in 3 °C increments. The on‐ and off‐rate constants were by globally fitting (red) a 1 : 1 kinetic binding model to the sensorgrams using the analysis software (v2.02; GE Healthcare) supplied with the instrument. Mean values (n = 3, ±SEM) determined for the on‐rate (k a), off‐rate (k d) and equilibrium dissociation constants (K d) are shown in Table 1.
