
Figure 5.
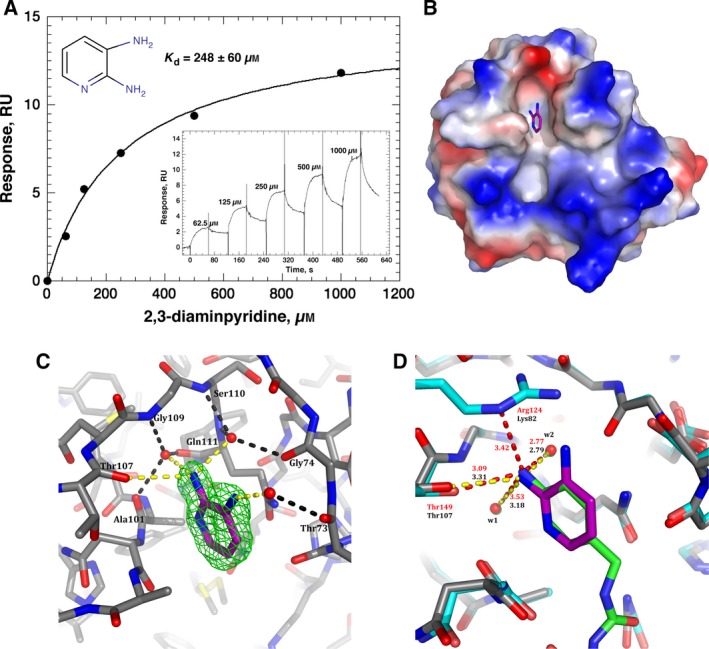
Binding and structural analysis of His‐CypA–2,3‐diaminopyridine complex. (A) Reference corrected SPR single‐cycle kinetic sensorgrams (black), monitored on a surface with 2866 RU of covalently stabilised His‐CypA (300 nm, 30‐s contact following 180‐s activation) for the indicated 2,3‐diaminopyridine concentrations (1 mm–62.5 μm). The apparent equilibrium dissociation was determined by fitting (red) a 1 : 1 Langmuir binding model (inset) to the sensorgrams using the analysis software (v2.02; GE Healthcare) supplied with the instrument. The mean K d value is 248 ± 60 μm (n = 3, ±SEM). (B) Electrostatic surface of the structure of CypA in complex with 2,3‐diaminopyridine (PDB: 5LUD). The ligand is drawn with purple carbons and is observed in the Abu pocket, the hydrophobic active site is below in the orientation shown. (C) Electron density and 2,3‐diaminopyridine–CypA interaction details. The omit electron density (F o − F c) contoured at 3σ is shown around the 2,3‐diaminopyridine ligand as a green mesh, all ligand atoms are clearly defined in density. Direct hydrogen bond interactions to the ligand are represented as yellow dashes, while bridged water–protein hydrogen bonds are represented as black dashes. (D) Comparison of the CypA–2,3‐diaminopyridine structure (grey carbons – protein, purple carbons – ligand) and the CypD–ligand structure of 4J5C (Cyan carbons – protein, Green carbons – ligand). Comparitive distances in the respective complexes are indicated (yellow dashes/black labels, CypA–2,3‐diaminopyridine; red dashes/red labels CypD–ligand structure 4J5C).